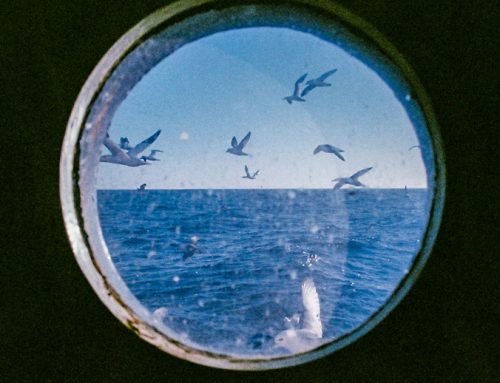
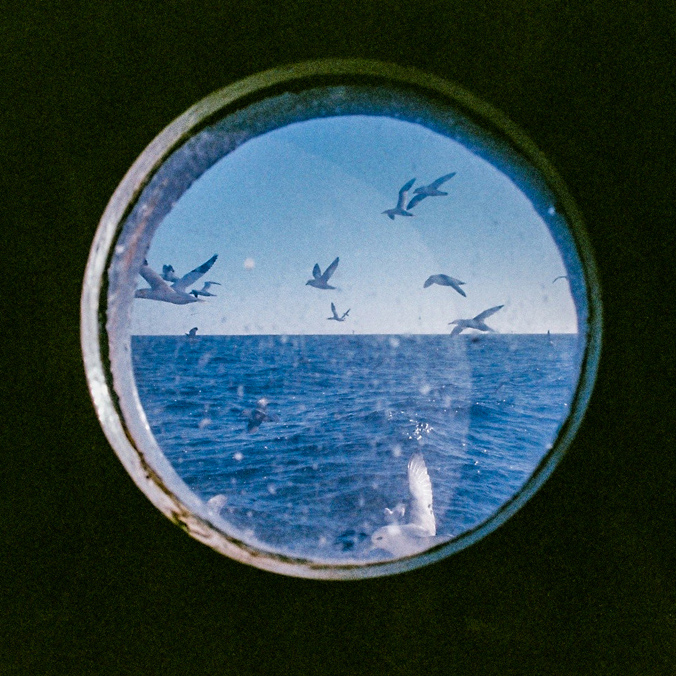
We talked with Dr Tara Marshall, a senior lecturer at the University of Aberdeen, about her work and previous collaborations with FIS. Tara has been a key part of five different FIS projects over the years, including the first ever FIS project, FIS001, which highlighted key knowledge gaps that FIS research should help address. Now, she shares how the results of FIS011B (developing potential future FIS projects in innovation in selectivity) laid the groundwork for her new paper, which explores how data can generate real-time maps of where fish are (hot spots), and where they aren’t (cold spots).
A common theme of FIS projects is their focus on creating relevant, positive actions for the fishing industry. Tara tells us straight away that she enjoys working with FIS because, as a scientist, she loves innovative research and especially research with the direct impact required of all FIS projects “on the water”.
Tara’s latest paper, written with colleagues and published in Fisheries Research, is “Estimating spatio-temporal distribution of fish and gear selectivity functions from pooled scientific survey and commercial fishing data.” It’s highly technical, and full of complex statistical models, so we asked Tara to break it down for us and explain its relevance to the fishing industry.
Building a map which represents the real-time distribution of fish
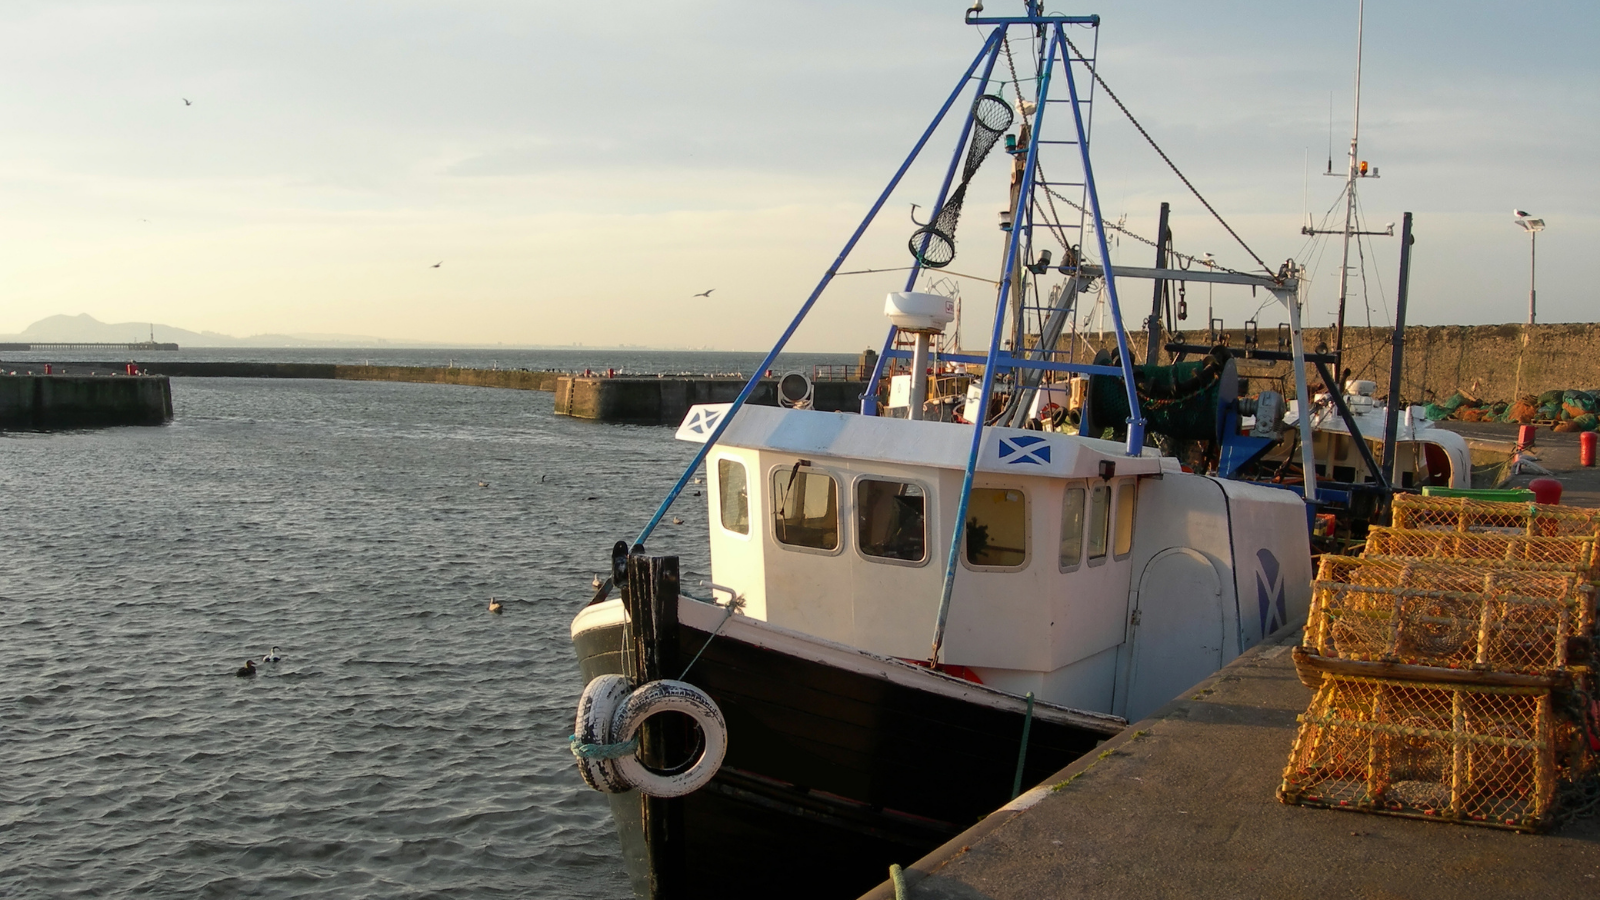
Tara tells us that the innovation at the heart of the paper is the novel approach her team used to combine two datasets describing fish locations in the North Sea. The first dataset came from research vessel surveys, which are conducted twice a year by Marine Scotland. These scientific surveys sample the entire fish community of the North Sea using gear which also catches juvenile fish, providing Marine Scotland scientists with valuable information about the number of incoming fish into the population (known as ‘recruitment’ in the fishing community).
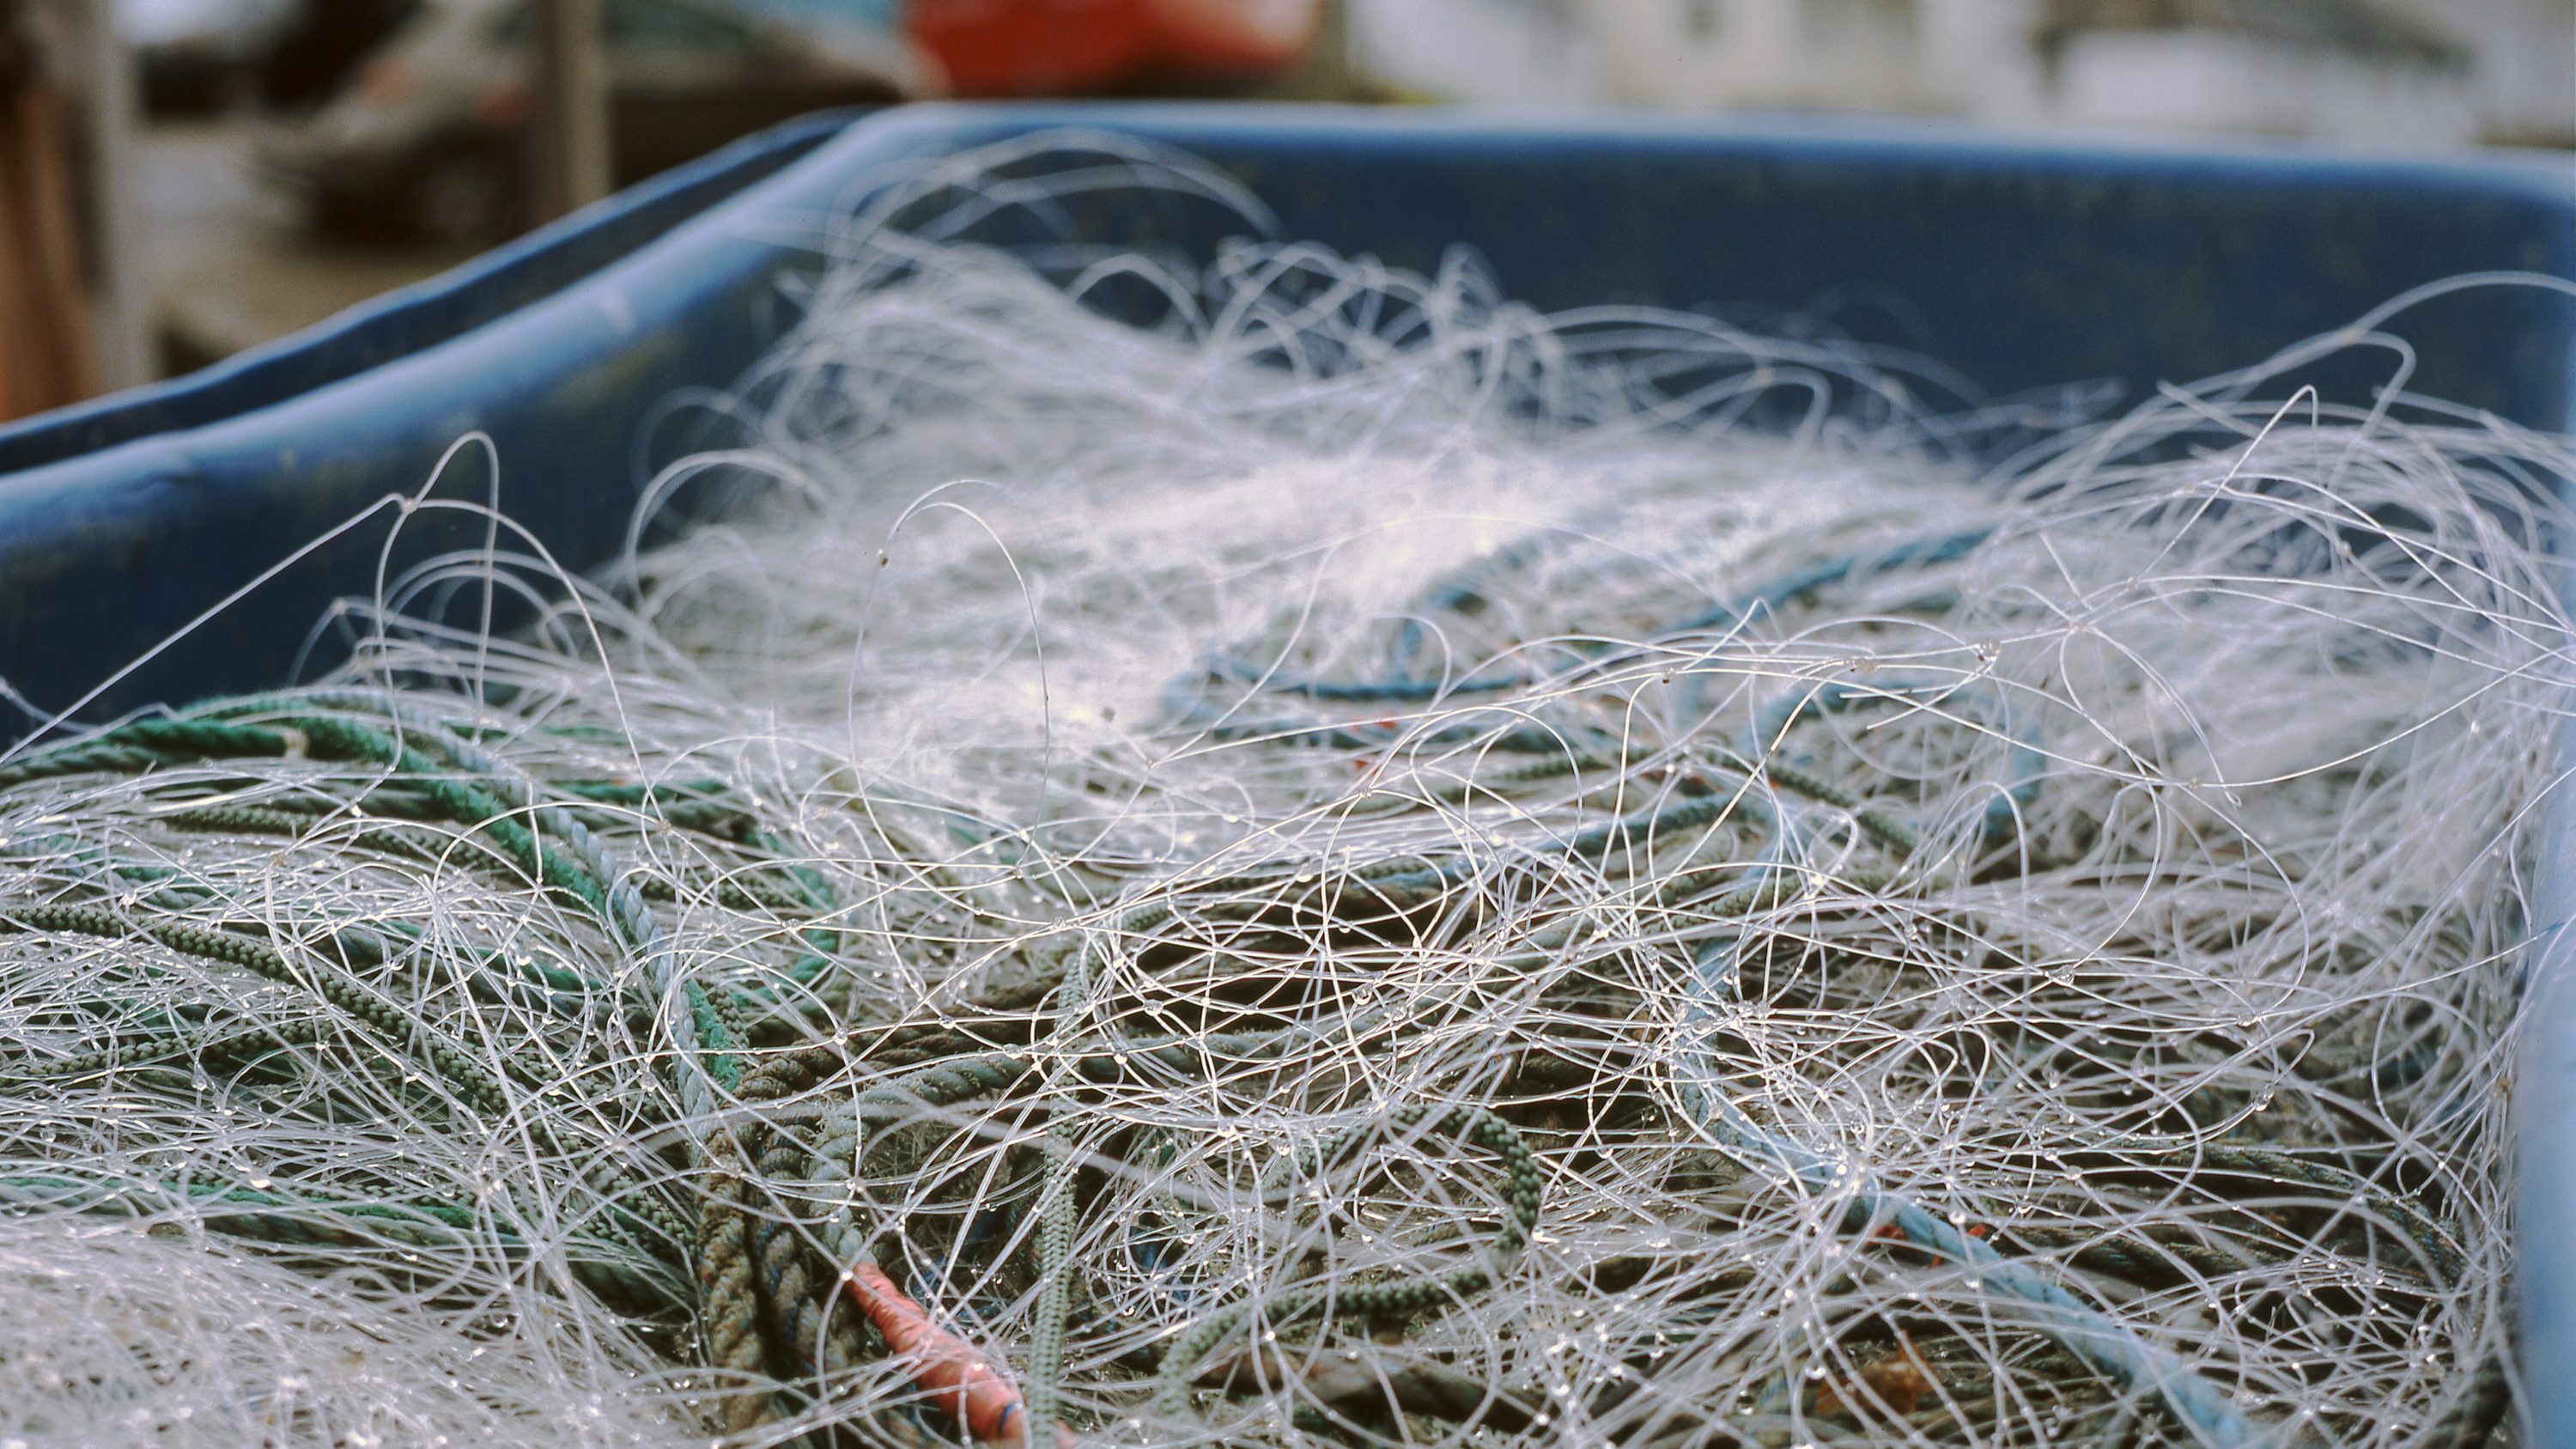
The second source of data were from a set of fishing vessels collected in 2011-2014, which sampled specific fishing grounds rather than the whole North Sea. The industry dataset was also more complicated because it included nine different gear types, none of which effectively sampled the smaller-sized fish that fishing vessels want to avoid. “We used state-of-the-art statistical models to combine scientific and industry datasets which are fundamentally different”, Tara tells us, “By combining them we can map when and where small cod are in the North Sea”. These maps, when continuously updated with new data, could potentially be useful in deciding where and when to fish.
So, is it possible to combine these very different data sources in such a way that generates informative maps describing where fish are (hotspots) and where they aren’t (coldspots)? The customary answer is no, Tara explains, but their paper shows that, by using the right statistical model, the answer is in fact yes. “Our model uses the datasets themselves to estimate selectivity curves for each of the nine gear types and these curves are used to correct data from each gear type for differences in how they sample, or select, fish of different lengths”. With these curves, or models, it becomes possible to combine scientific and industry data to generate maps showing the monthly distribution of juvenile cod in the North Sea. Tara says “Our paper is relevant to fishing nations around the world because it is the first paper to effectively combine datasets from both scientific surveys and fishing vessels. Our statistical approach can be applied anywhere.”
Next Steps and Goals
Tara explains that the long-term goal of her research is to develop mapping capabilities that function more like weather forecasting models. We think nothing of checking the weather in the morning to consider if we need to carry an umbrella, and Tara’s aim is for fishermen to have a similar resource. Some short-term forecasting models already exist for helping fishers to avoid bycatch of charismatic species such as sea turtles and marine mammals – Tara cites EcoCAST, developed by NOAA scientists for waters off California, as one example. A real-time map that continuously updates with new industry data to show where the commercial fish are, or aren’t, doesn’t yet exist.
In the short-term, a more achievable goal is to map industry data in real-time without using a complicated statistical model. However, a key barrier is accessing enough data from fishing vessels given that fishers are reluctant to share information about their catches even amongst themselves. Preliminary steps to increase the amount of data available have already been taken in projects FIS011B (which formed the foundation of the recently published paper), and also FIS032 – which co-funded the development of BATmap, a ‘By-catch Avoidance Tool using mapping’. BATmap is currently being used by 14 fishing vessels on the west coast of Scotland to avoid catching unwanted species such as cod and spurdog.
“BATmap is unique. It takes advantage of the continuous stream of catch data being generated by fishing vessels, and importantly has been developed and funded by the industry. Scottish skippers who would be using the app have co-designed it, which ensured that BATmap would be trusted from the start.” The involvement of Scottish skippers in BATmap was the key innovation behind the project’s success, and Tara is resolute that encouraging the industry to engage with their own data, for their own benefit, is the first step towards co-managed fisheries, and the development of a useful map of fish locations.
Tara finishes the interview by explaining that the paper is only one more step in the “long-road” towards hotspot mapping. It shows us how innovative statistical models, informed by real-time industry data, could make big changes on the water in the future.
